Let’s use a UserForm to dynamically change the data range of a graph in Excel VBA. In this article, I will introduce a method to specify the start and end rows using two text boxes and update the chart display range by clicking an “Update” button.
1. Create the UserForm
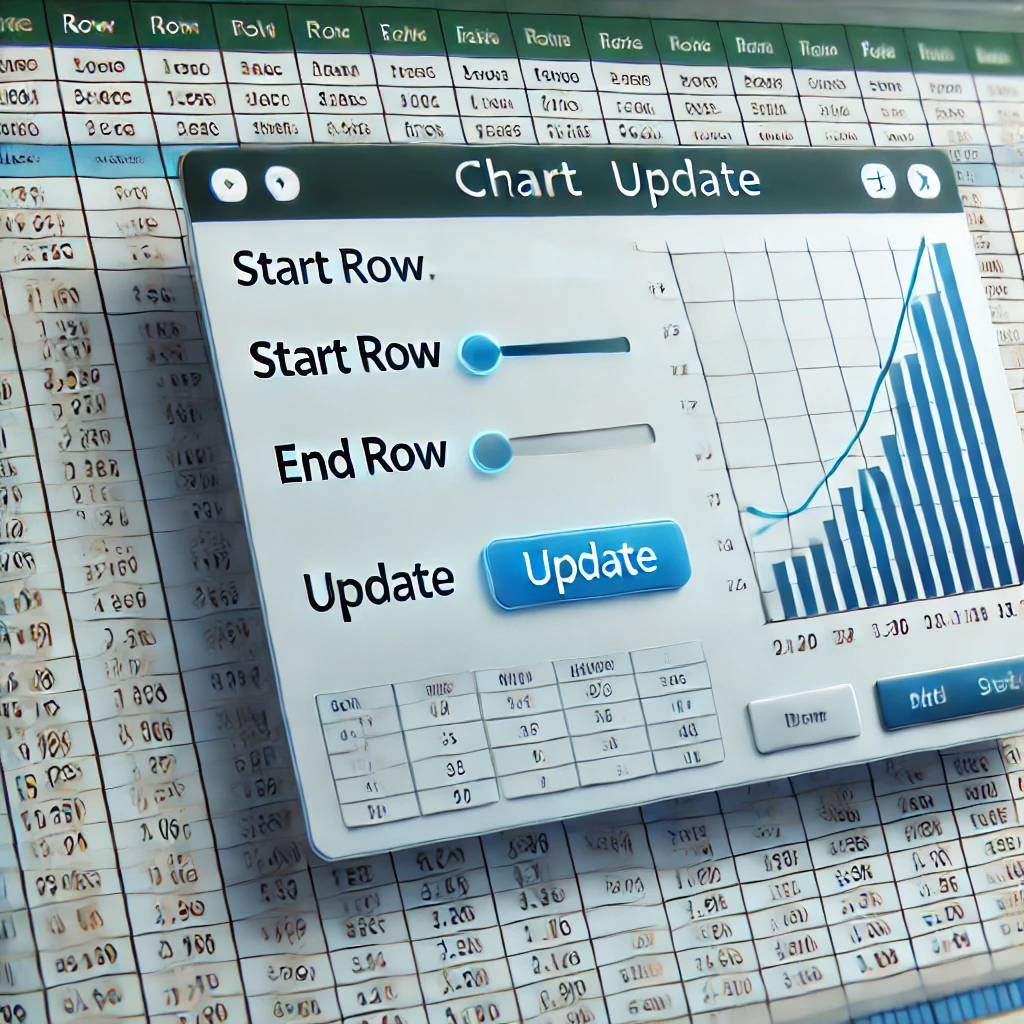
First, select Insert -> UserForm in the VBA editor to create a new form. Add the following elements to this form:
- 2 Text Boxes (for entering the start row and end row)
- 1 Button (an “Update” button to change the range)
Set up the form layout as follows:
- TextBox_StartRow: Input for the start row of the range
- TextBox_EndRow: Input for the end row of the range
- CommandButton_Update: The “Update” button
2. Write the VBA Code
Next, add VBA code to a standard module. This code will dynamically change the specified chart’s range based on the values entered in the two text boxes.
In this example, the sheet name is set to “DataSheet”, the chart name is “SampleChart”, and the data range uses columns A and B. Please change the sheet and chart names as needed for your file.
Code for the Standard Module
Sub ShowGraphUpdateForm()
    ' Show the UserForm for graph updates
    GraphUpdateForm.Show
End Sub
Next, add code to the form itself so that the chart range changes when the “Update” button is clicked.
Code for the UserForm
Private Sub CommandButton_Update_Click()
    Dim startRow As Long
    Dim endRow As Long
    Dim chartSeries As Series

    ' Get values from text boxes and convert to numbers
    startRow = CLng(TextBox_StartRow.Value)
    endRow = CLng(TextBox_EndRow.Value)

    ' Check if start and end rows are in a valid range
    If startRow < 1 Or endRow < 1 Then
        MsgBox "Error: Data starts from row 1.", vbExclamation
        Exit Sub
    End If

    If startRow >= endRow Then
        MsgBox "Error: Start row is greater than or equal to end row. Please enter a valid range.", vbExclamation
        Exit Sub
    End If

    ' Get the chart named "SampleChart" on the "DataSheet"
    Set chartSeries = ThisWorkbook.Sheets("DataSheet").ChartObjects("SampleChart").Chart.SeriesCollection(1)

    ' Set the new range
    chartSeries.XValues = "=DataSheet!$A$" & startRow & ":$A$" & endRow
    chartSeries.Values = "=DataSheet!$B$" & startRow & ":$B$" & endRow

    ' Display message
    MsgBox "The chart range has been updated.", vbInformation
End Sub
Key Points of the Code
- Validation: The code checks
If startRow >= endRowto ensure the start row is not greater than or equal to the end row. If the range is invalid, it displays an error message and stops the process. - Updating Properties: It uses
chartSeries.XValuesandchartSeries.Valuesto dynamically set the data ranges for the X-axis and Y-axis.
3. Display the Form Using a Button
Create a button on your Excel sheet and assign the ShowGraphUpdateForm macro to it. Now, when you click the button, the form will appear, allowing you to update the chart range by entering row numbers.
Summary
By using VBA UserForms, you can easily control chart data ranges. This makes changing ranges simple, even with large amounts of data, improving the efficiency of data analysis and report creation. Let’s continue to extend Excel’s capabilities with VBA automation to make it even more useful!